CYNTHIA INTRODUCES…
A NEW Template with a Currency Strength Meter
plus some of my favorite indicators.
BIG PROBLEM FOR FOREX TRADERS:
Finding strong trending pairs to trade is always time-consuming and not easy.
Following currency strength is a very important aspect if you plan to be a successful forex trader.
Currency markets are influenced by macro economic events, and move differently than any other asset.
This Currency Strength Meter is now the most important item in my trading toolbox.
I rely 100% on using it for determining pairs to look at to potentially trade.
Use the Currency Strength Meter to find trades so you don’t have to search the market for hours looking for the right setup…it makes finding trending pairs a breeze.
Using the CSM only takes as little as 3 minutes a day to plan your trades.
Every forex trader needs to learn how to use a Currency Strength Meter… I make it easy!
If you need help finding trending pairs to trade,
please read on.
SOLUTION FOR FOREX TRADERS
What is a Currency Strength Meter?
Imagine you could know which currency is moving the strongest at the moment?
Now what if you could also know the weakest currency at the same time?
You would therefore be able to buy the strong one while selling the weak one. This trade will have the most momentum and highest probability.
In simple terms, a Currency Strength Meter helps you find the biggest movers against peers. We always look to pair the weakest currency with the strongest currency so that the probability of continuation is at the highest possible point.
A Forex Currency Strength Meter looks at all the common currency pairs and evaluates the strength/weakness level for each individual major currency, in real time. It takes into account both the base and cross currencies.
By using a currency strength meter you can trade the active market momentum and avoid all the chop and head fakes.
Understanding a Simple, Powerful Truth:
When it comes to trading currencies, the only objective we have is to pair a currency that is losing value with a currency that is gaining value in order to create a match up that moves in a given direction.
In other words, if the Euro is gaining value (strong) while the USD is losing value (weak) then the EUR/USD is going to move upward exponentially which creates profit potential.
There are four main trading applications for a CSM:
1. Buy strongest currencies against weakest currencies (long momentum trades)
2. Sell weakest currencies against strongest currencies (short momentum trades)
3. Sell strongest currencies against weakest currencies (fading strong momentum, not advised for new traders)
4. Buy weakest currencies against strongest currencies (reversing weak momentum, not advised for new traders)
A Problem with Trends
We know that it’s the difference in strength between currencies that creates movement that is required to make money in the currency markets, BUT it is incredibly difficult to scan through price charts and determine which currencies are the best to pair with one another (by looking at pair charts, you don’t actually know which currencies are truly gaining value because it is all relative).
After all, how do we know if the EUR/USD is rising because the Euro is gaining value, the USD is losing value, or both?
The real conundrum here is that IF the EUR/USD is only rising because the Euro is gaining value, for instance, then if the Euro quits gaining value the pair will quit rising; whereas, if the EUR/USD is rising because the Euro is gaining value and the USD is losing value, the Euro could lose strength but the pair could continue to rise solely on the USD continuing to remain weak.
So, as you can see, it’s essential to pair the right currencies if you want the best chance of success.
Currency Strength Meter – Conclusion
These days the global currency markets are interconnected, and you should be following the relative momentum using a Currency Strength Meter.
Therefore, it is not about deciding whether or not you need to use one, but HOW to implement it to your strategy.
It is, in short, an indispensable tool in trading, as it will show you an at-a-glance view of the current market conditions, allowing you to make timely decisions while taking advantage of strong current market trends…
If you are a momentum trader, this Currency Strength Meter is gold for you.
Faders and scalpers will also find value in this tool on the lower time frames.
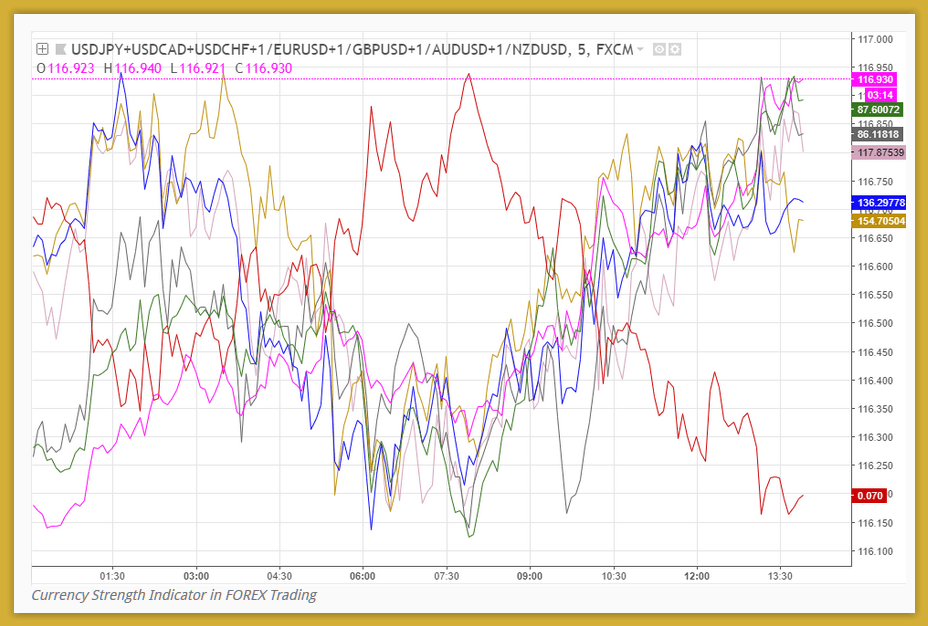
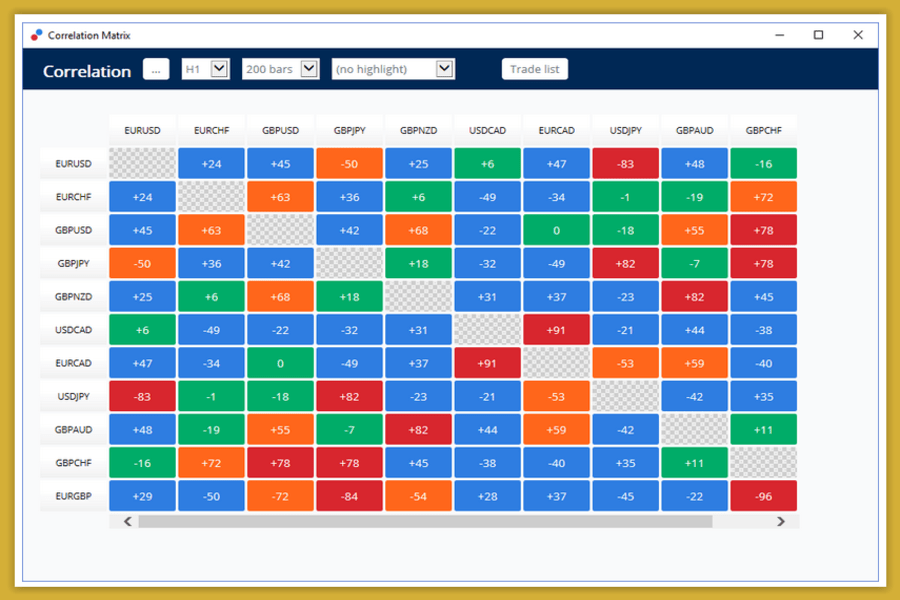
Here are two pictures of some typical-type Currency Strength Meters:
Umm….not what I’d call at-a-glance CSM…I remember about 10 years ago when this was the first type CSM on the market and it sold for $10,000….not for me then, and not for me now:
This is a CSM that is actually a correlation matrix chart…again, not so great at seeing at-a-glance what pairs to go look at:
Quit Guessing About Currency Strength!
What if there was a tool that instantly told you which individual currencies were the strongest and weakest so you could effortlessly choose the best moving pair at-a-glance?
Here’s a pic of the CSM I like the best, this is what I call at-a-glance simplicity…once you learn about the simple color value correlations, it’s super easy to use and with a glance of about 2 seconds, you’ll know what pairs to go look at:
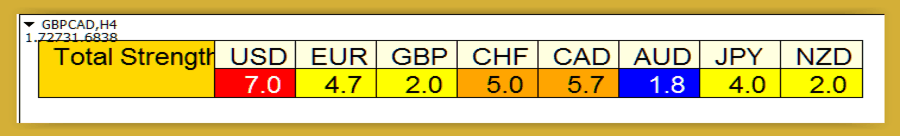
The color code used in the meter is pretty self-explanatory, with:
BLUE is very weak (0.0 ~ 2.0)
YELLOW is weak (2.0 ~ 5.0)
ORANGE is strong (5.0 ~ 7.0)
RED is very strong (7.0 ~ 9.0).
The GBP is a weak yellow at 2.0 and the CAD is a strong orange at 5.7, so the GbpCad is selling off, the trend is down for this pair.
Also the AudUsd pair is being sold because the AUD is a very weak blue 1.8 versus a very strong USD red 7.0.
We sell the weaker currency (AUD) and buy the stronger currency (USD), but as a pair….so the CSM helps us see this.
Once you start using the CSM, it gets very easy to see at-a-glance, which pairs to go look at. This saves you an incredible amount of time, no more flipping thru dozens of charts looking for a pair to trade, getting confused, and getting it wrong 99% of the time!
It doesn’t matter what time frame you put the meter on because it’s not reacting to the time frame, it’s reacting to the immediate strength or weakness of all the 8 currencies.
But you can and should look at charts with indicators, at the monthly, weekly, and daily levels, to see if the current trend is long term and strong, or short term and weak…it can make all the difference. The CSM is showing you current values and as such, is best used for scalping or day trading…but if you like to swing trade, you’ll have to confirm the major trend in the higher time frames and use the CSM to get the best entry after a pullback.
Don’t worry, it’s much easier than you think! It just takes some practice in a demo account.
Here’s a short video explanation of how to use the Currency Strength Meter:
The Currency Strength Meter Template can be used as a stand-alone trading system or be used with any other trading system.
YOU HAVE A CHOICE BETWEEN A BASIC CSM TEMPLATE AND A PRO ADVANCED TEMPLATE.
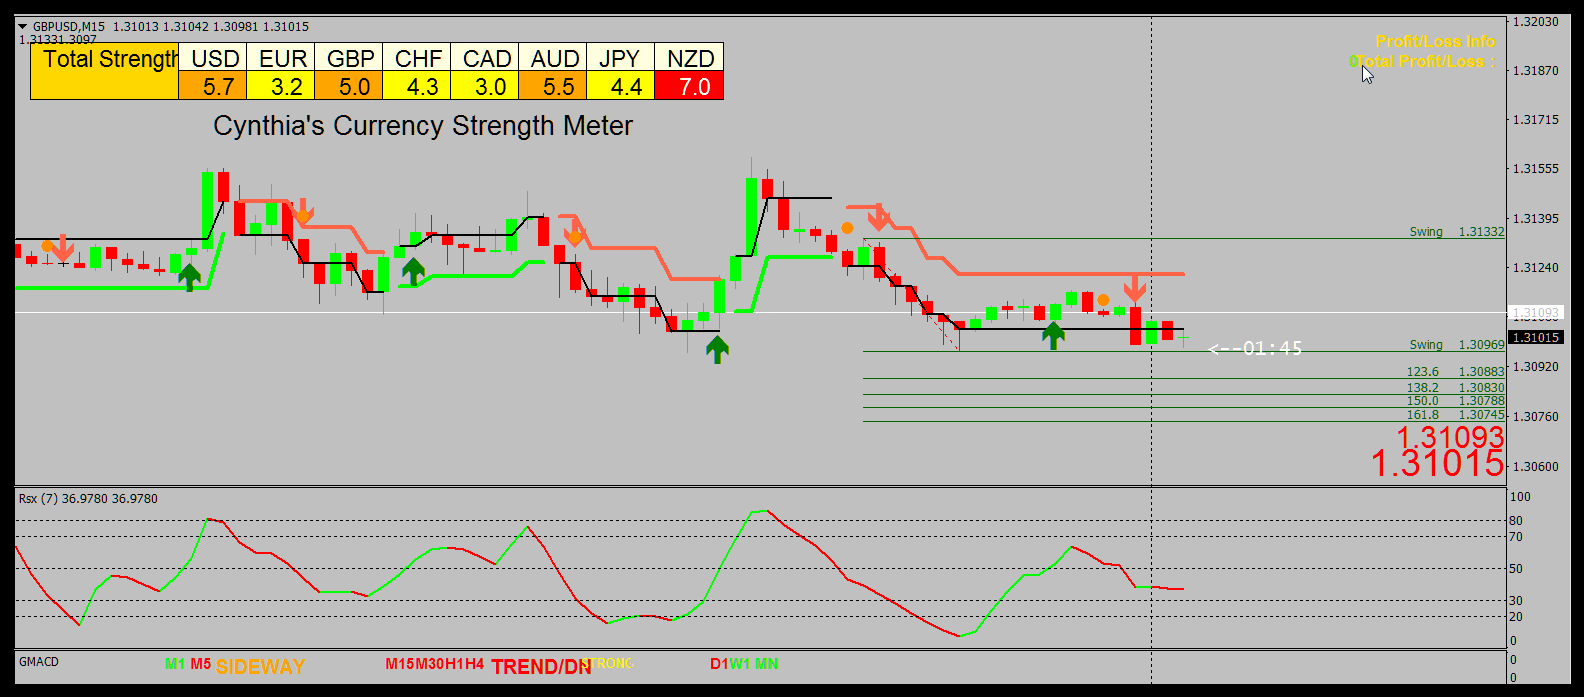
HERE IS THE BASIC CURRENCY STRENGTH METER TEMPLATE
You can see that the USD is a strong red and the CAD is a weak blue, and for several hours and on the last candle, the trend is up as traders are buying the USD and at the same time selling the CAD:
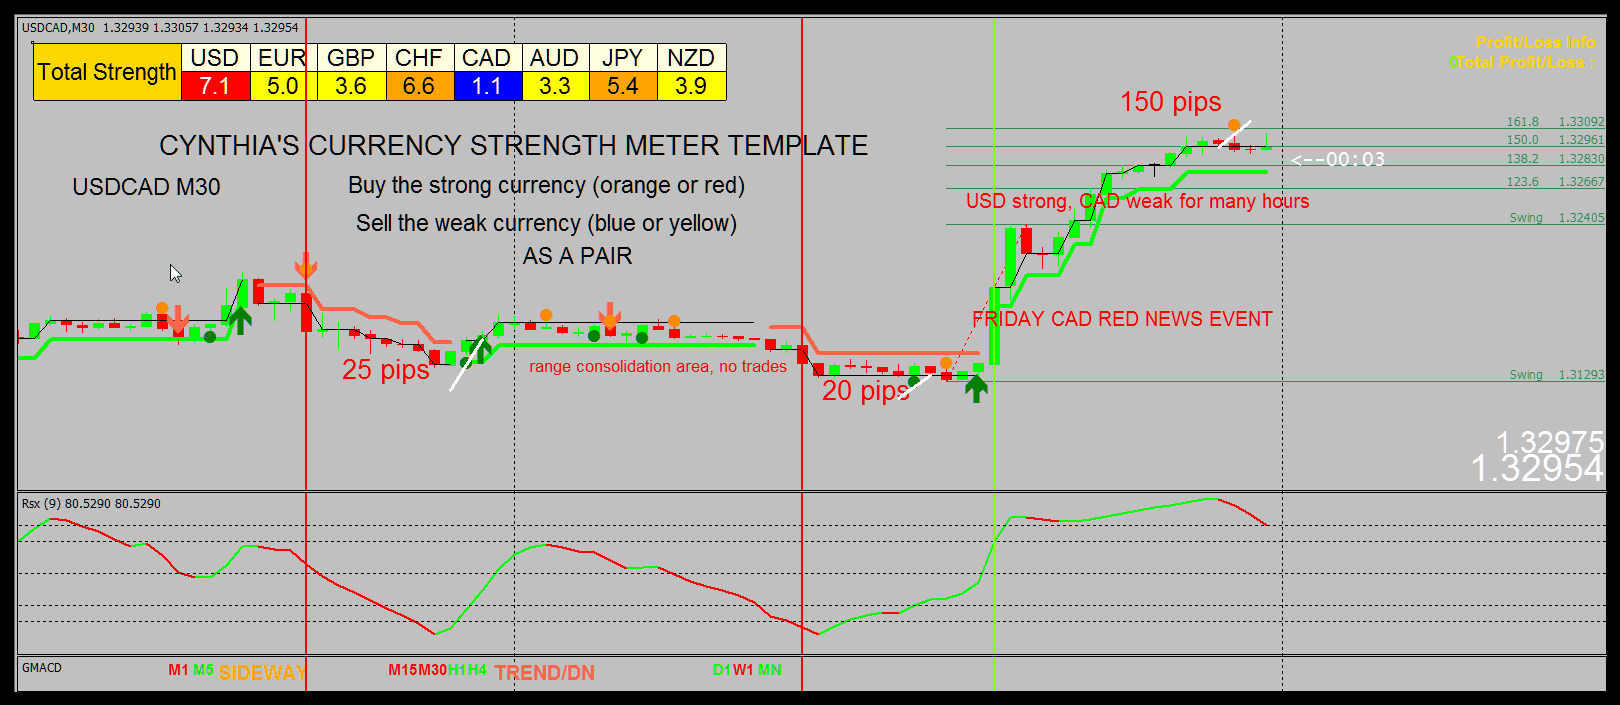
Buy the stronger currency, Sell the weaker currency.
Here is the GbpUsd M15 at the end of the day when the USD and GBP are relatively the same orange medium strong strength, although the GBP is slightly weaker…so the trend is flat and the price is sitting on a Fibonacci swing line…if it breaks down lower, the GBP will get weaker as the USD gets stronger and the fib extension levels are automatically drawn for targets:
You can see the price channel where earlier the price broke down below the green support line and a orange dot and red sell arrow appeared. That downswing would have been a weak GBP and strong USD, as the GbpUsd moved strongly down during a red news event.
At the end of the day, the GBP was slightly weaker with an orange 5.0 vs a stronger orange USD at 5.7, so the GbpUsd is moving down slightly but shows a green Doji candle which is a pause in momentum…this is because the two pairs are both slightly on the orange strong side so there is at the moment, no strong momentum, although the trend is still to the downside.
Sell the weaker currency and Buy the stronger currency.
HERE’S A EURUSD H1 CHART OF A NON-FARM PAYROLL AND USD: ISM RED NEWS FRIDAY USING THE PRO ADVANCED CSM TEMPLATE
Non-Farm Payroll (NFP) and USD: ISM red economic news events can really move the markets…and not just the USD crosspairs, and the first 30 minutes usually see large swings up and down…what’s called a ‘whipsaw’… generally the first 30 minutes should be avoided, unless you’re a very proficient trader and can trade in the 1 min/5 min/15 min set up.
After all the hoopla, at the last candle, you can see the the EurUsd trend is up, and if you look at the CSM, the EUR is a extremely strong red 7.1 against a strong orange USD at 5.4, so at the end of the day, the EurUsd is still going up strongly BECAUSE THE USD IS WEAKER than the EURO and traders are still buying the EurUsd pair:
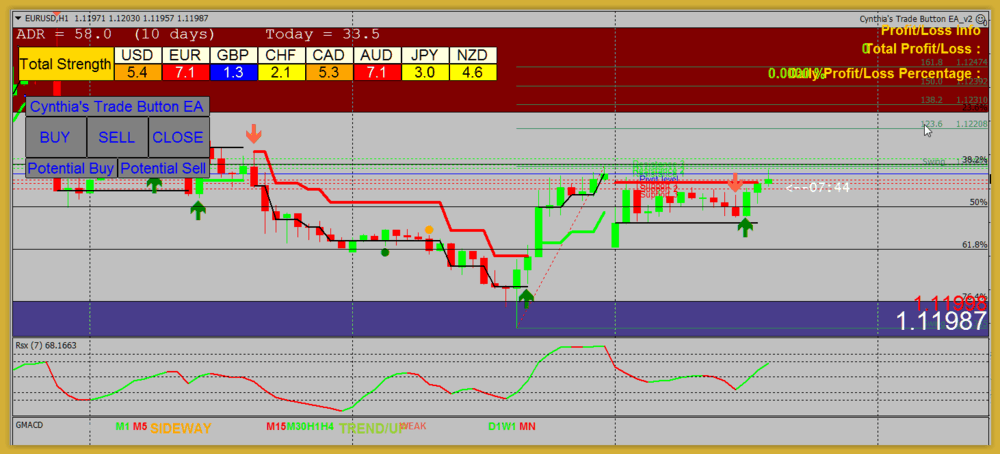
Sell the weaker currency and Buy the stronger currency.
EXAMPLES OF THE CSM INDICATOR ON THE NEON BREAKOUT CHARTS
Here’s a pic of the CSM indicator on a GbpCad H1 chart, and you can see the end of the candles where the GbpCad has fallen into 4 hours of consolidation after the big drop:
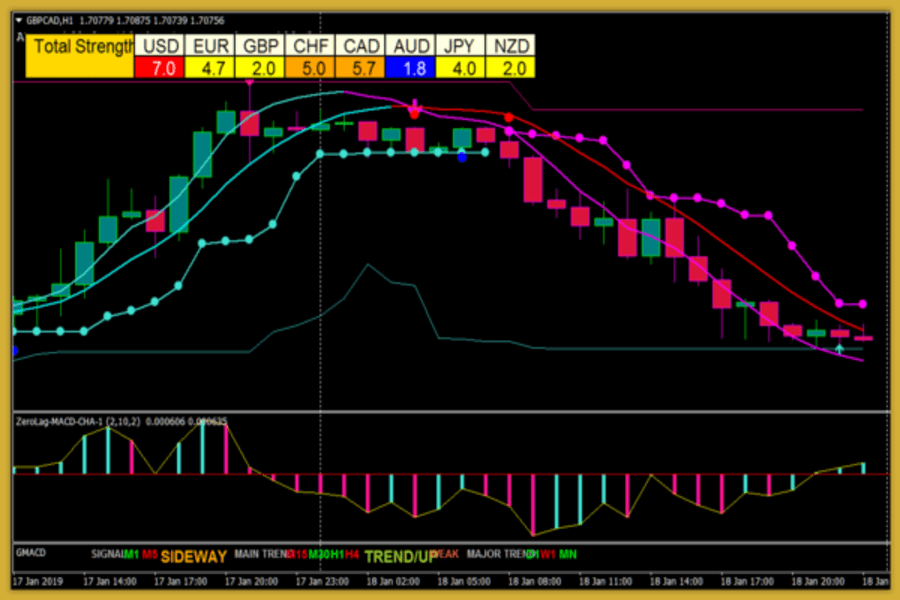
In this instance, the GBP was weak (yellow) for many hours and the CAD is a strong orange….at times the meter might have shown the GBP as very weak (blue) and the CAD might have shown very strong (red)….the meter does fluctuate due to the changing immediate strength and weakness of the currencies….so…
on the green candles, the CSM would have changed values as the GBP strengthened against the weaker CAD….this would reflect a pullback in trend, and after the pullback ended, when the GBP weakened again and the CAD strengthened again, would be a possible opportunity to jump in with a trend trade.
The red candles reflect a weaker GBP against the stronger CAD.
Sell the weaker currency and Buy the stronger currency.
Here’s a H1 AudUsd chart that shows the candles and trend reflecting the very weak blue 1.8 AUD and the very strong red 7.0 USD…so the AudUsd has been going down:
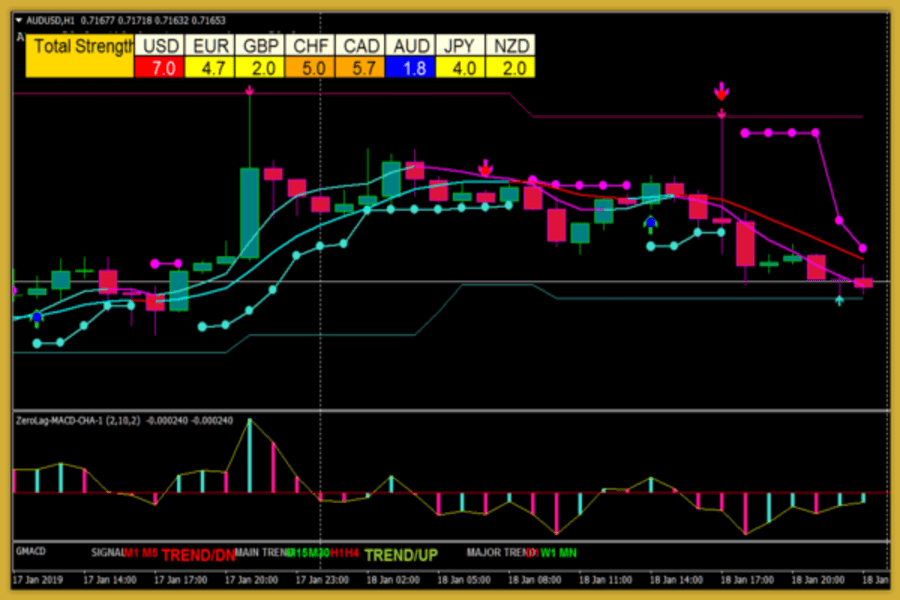
As you can see, the Currency Strength Meter individually rates each of the currencies so that you know the “true strength” of a currency rather than just trying to determine its strength by looking at a price chart.
The CSM comes on a special template with a few of my favorite indicators to help with refining your entries, and I’ve made some training videos to show you how to use it, which you’ll find in the PDF after you purchase… you can use the special template as a stand-alone trading system or use it with any other trading system you enjoy.
YOU CAN ALSO USE THE CSM INDICATOR ON ANY CHART OF ANY TRADING SYSTEM.
I show you in my intro video how to use it with my Simple Neon Breakout System:
As you can imagine, using a CSM is a huge advantage when it comes to taking advantage of the most powerful market trends.
The CSM works with tick data and changes all the time, it may not be very accurate in backtests, but if you just want to see where the market is at in any given point of time, it gives a clear immediate picture.
Of course, one word of warning, as with everything Forex, there is no absolute. These methods have shown to work in the past, and it is relatively reasonable to expect them to work in the future, but of course, there is no guarantee…
Even if sometimes all conditions are right, these methods may not work due to other factors, such as unscheduled (or even scheduled) news releases, market sentiments, order flows, etc… that are beyond the scope of these methods, so always use caution and most of all, common sense, when using the CSM.
I’ve found that using the CSM is effective over 80% of the time, and that is considered great odds for Forex… So feel free to trade it on demo accounts first, and give it time to practice, you’ll thank me later.
To keep abreast of red economic news events that can drastically affect the readings of the CSM values, please always watch the Forex Factory Calendar:
https://www.forexfactory.com/calendar.php
Use the filter to set up the calendar for your timezone and filter only the red news events.
You can watch the CSM before a red news event and then see the changes in values after the red news event…look at the higher time frames to see if the major trend is the same or has changed…trade the pullbacks using the CSM and your indicators to time your entry.
Taking Advantage of the Currency Strength Meter
The key regarding the Currency Strength Meter is making sure that you combine the individual strength with other components because, of course, strengths are always fluctuating.
You won’t always win by just matching the strongest currency with the weakest one and clicking “Buy”, because of the constant fluctuation in the market.
I suggest using things like RSI, MACD, trend lines, channels, fibonacci retracements, support and resistance zones, etc., in order to enhance the timing of your entry when matching up the currencies.
Also, it’s important to use your trading system to look at the major monthly, weekly and daily trends, to see if the trend is long term or short term…it’s important to know this.
Use the Currency Strength Meter to find trades so you don’t have to search the market for hours looking for the right setup… it makes finding trending pairs a breeze.
Once you see a pair to go look at, refine your entry by using other indicators as mentioned. You can’t just use the CSM all by itself, you have to use other indicators. I use the CSM to trade any of my own color coded trading systems, each with unique indicators…but in my training videos I use my Neon Breakout system.
Using the CSM only takes as little as 3 minutes a day to plan your trades.
Every forex trader needs to learn how to use a Currency Strength Meter… I make it easy!
IMPORTANT!
You have a choice between my BASIC CSM and my PRO CSM.
While the Basic CSM is great, some traders might really like the Advanced PRO features.
It’s especially important because of the One Click Buy, Sell, Close Trade Button that’s only in the PRO CSM Template.
PLEASE WATCH A VIDEO THAT COMPARES THE BASIC CSM TEMPLATE WITH THE PRO CSM TEMPLATE:
The Basic CSM Template is a cool non-refundable $77…
Please click the link below if you would like to purchase only the BASIC CSM for $77, which includes my special template with some of my favorite indicators:
CLICK HERE to visit the Basic CSM page to purchase
BUT WAIT!
SPECIAL OFFER !
Purchase the Basic and PRO together for only $147!
If you would like to purchase the Basic and PRO CSM together for only $147, which includes more favorite indicators AND my ONE CLICK BUY, SELL, CLOSE TRADE PLACEMENT BUTTON PLUS INCLUDES MY TRADE MANAGER TRAILING STOP, please click below:
CLICK HERE to visit the PRO CSM page to purchase
TODAY THIS PURCHASE INCLUDES THE BASIC CSM TEMPLATE AND THE PRO CSM TEMPLATE!
Normally, the Basic CSM Template alone is $77 and the PRO CSM Template alone is $147… order now and get BOTH for only $147.
NOTE:
You can use the CSM template as a stand-alone trading system, OR, you can use the template OR even just the CSM indicator without the template, with any other trading system that you like. If you are interested in trading the CSM template or CSM indicator with my Simple Neon Breakout, please visit this page to learn more about the Simple Neon Breakout Trading System:
https://daytradeforexcolor.com/Simple-Neon-Breakout
If you have questions or need support, you can reach Cynthia here:
currency.strength.meter.assist @ gmail.com
(remove the spaces)
To your trading success!
Cynthia

NFA Required Disclaimer: Forex trading may not be suitable for all customers. Forex trading involves a substantial risk of loss. Simulated conditions may differ from real conditions and traders should not necessarily expect the same results from live trading.
DISCLAIMER: The information on this site is for educational purposes only. Trading is risky and is not suitable for everyone. Only risk capital should be used. You are responsible for your results and agree to hold everyone else harmless if you lose.
No representation is being made that any account will or is likely to achieve profits or losses similar to those discussed on this website. The past performance of any trading system or methodology is not necessarily indicative of future results.
The entire Simple Neon Breakout and Currency Strength Meter trading systems are proprietary intellectual property of Day Trade Forex, LLC and MUST NOT be shared for free OR illegally re-sold on any websites without the legally registered Day Trade Forex, LLC JVZoo buy button, OR illegally re-sold via emails or discount websites or ebay, subject to international copyright laws and DMCA penalties.
© 2020 Day Trade Forex, LLC