The 4 hour chart can be a little easier than the Daily chart to get the best entries and you can still make a lot of pips.
Monitoring every one or two candles is easy.
There is the long slow red trend line that tells us that we are only going to be taking sell trades because the major trend is down.
Then you have two fast action colored trend lines… magenta for down trend and aqua for up trend.
Notice how the first red sell line I drew occurs on the same candle that shows a big red arrow and a big magenta dot.
You can sell when either of these appear and if they appear at the same time, that’s a great signal!
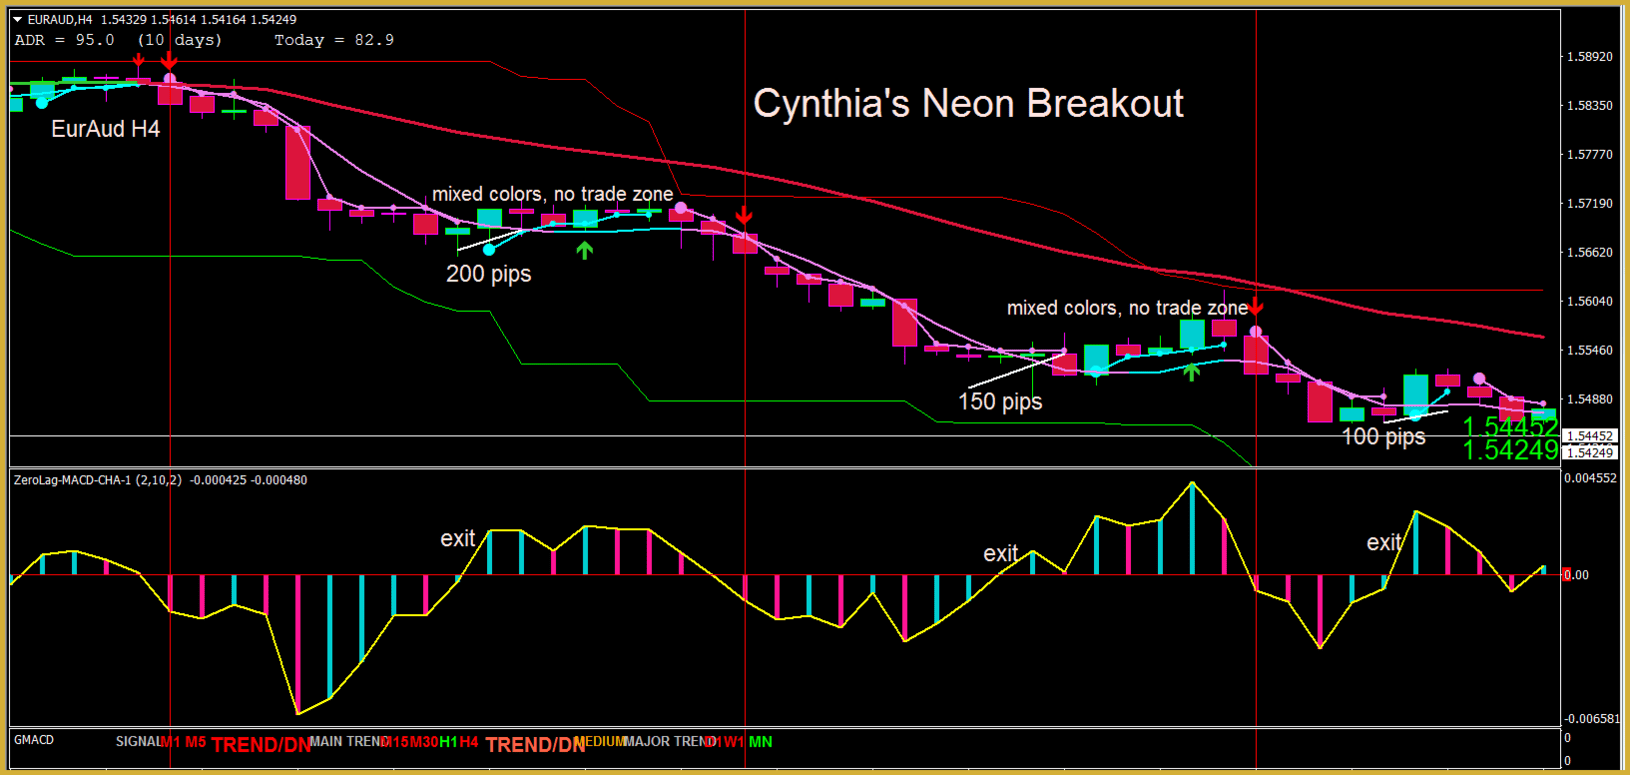
And if you let your eye wander down to the bottom momentum window, you’ll see the pink bar has crossed the red zero line… this shows that the price has strong momentum. We only enter a trade when the volatility bar has crossed the red zero line. Discipline, patience!
When the colored bars in the bottom window change slope and color, that means the trend and momentum is changing.
In this picture, after I placed the first sell trade, two bars later there was a slight retracement pullback or slowdown of the down trend… the candle turned from pink to aqua and the pink bar changed to aqua in the bottom momentum window.
After the pullback ended and the downtrend resumed, the candle and momentum bar turns pink again and that’s another great sell entry in the major down direction (which I didn’t take but could have/should have).
This is called retracement trading and is the easiest and most profitable type of trading: trading with the continued trend after a pullback.
This trading system makes it really easy to see and trade the pullbacks or retracements.
Later when the price pushed down hard in one long candle and then the pink candles got very small, the pink bars momentum bars in the bottom window showed the slow down of momentum by changing to aqua and starting to slope up to the red zero line…. your sure sign of exit is when the aqua bar gets very close to the red zero line or crosses it. Also in the main window, you’ll get a change of candle color and a different colored big dot will appear to confirm your exit.
Here’s a picture of the EurAud H1 chart, it’s just a great mover most of the time!
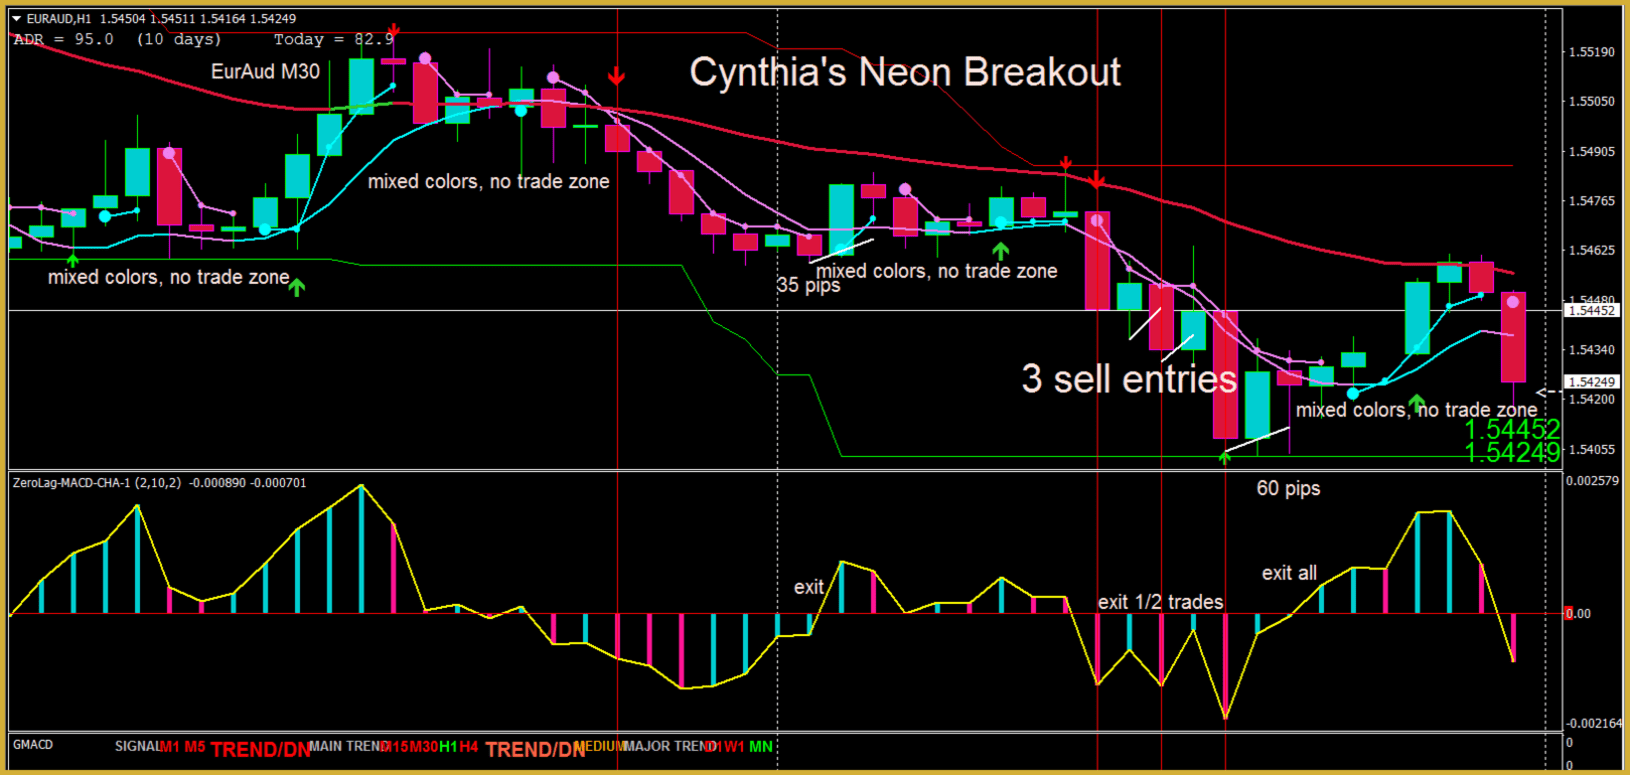
Notice how I was able to take 3 different sell entries on the downtrend after the pullbacks.
For money management, you can take partial exits before you place your new pullback trade and then when the momentum window gives you an exit when the momentum bar crosses the red zero line, close all the trades. This is explained in the PDF you’ll get.
Ready to watch a few more short videos and/or buy?
Click HERE to go to the watch-more-videos and checkout page!
Not ready to buy? Want to see another couple of charts?
Click HERE to look at some more charts!